A Night to Remember
The NFL draft doesn’t get much more fascinating than it was last night. The pregame ritual of charting the recession of Kiper and Boomer’s hairlines was as entertaining as always. The chorus of boos raining down on commissioner Goodell echoed furiously against the walls of the Auditorium Theatre in the great city of Chicago. Day 1 was headlined by two monster trades at the top of the draft, and the all-out attack on Laremy Tunsil, who fell to the Dolphins at pick 13 after his twitter profile was hacked. Later on in a post-draft new conference, Tunsil admitted to taking cash from an Ole Miss coach before being rushed off by his representation. Ole Miss, who have already self-reported various NCAA violations, look to be in a mess of trouble once the dust settles.
Aside from the personal drama last night, there were several draft trades, some of which had us scratching our heads here at 4C’s Analytics. It’s nothing new for a team with desperate positional needs and a general manager whose heart is too weak to stand the tension of waiting his turn to trade up in the draft. After all, the draft is about making your team better, and so waiting and drafting the best available player is really no longer an option in the free agency era. On the other end of these trades are teams in rebuilding mode who will use the draft in order to get the basic roster depth that the NFL demands. Thus the question of who wins these trades is a matter of perspective, but with our metrics, we can analyze them in a vacuum to see which teams come out on top.
Yesterday, we presented our draft value chart which plots a player’s Starting Power (SP) against his draft pick. We recall that SP is based on a player’s average salary during his second contract, normalized by the average starter salary at his position. We feel that SP is a quality performance metric, as the second contract salary implicitly contains a player’s net value relative to his position. The plot of SP vs. draft pick is then fitted with an exponential function, from which we obtain the final draft value chart. As mentioned yesterday, when assessing future picks we assume that the value of a 2017 2nd round pick is worth a 2016 3rd round pick. Okay, enough shop talk. Let’s look at the trades.
The Trades: Blockbusters Edition
The focus of yesterday’s post was to assess the value of the two blockbuster trades at the top of the draft between the Rams and Titans, and the Eagles and Browns. We saw that the Rams gained a net of 1.63 SP in their trade, and the Browns gained a net of 1.30 SP. But we all knew that Goff and Wentz would go 1-2, so let’s look at what happens when we factor that in to the trade. Below is a chart of SP vs. draft pick for all quarterbacks taken between 2005-2011.
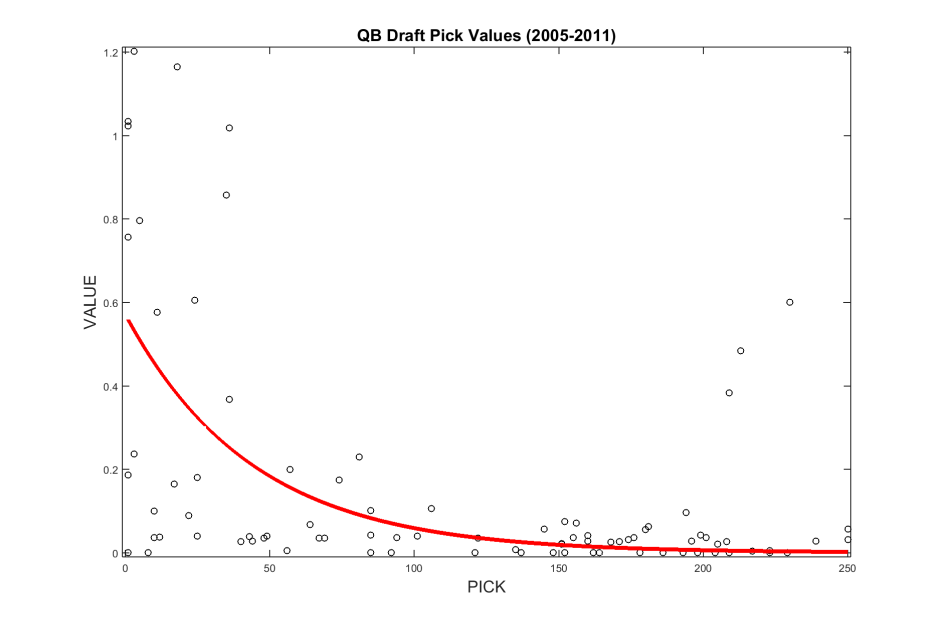
What we see here is interesting. Namely the SP of the first and second picks in the draft, assuming they’re quarterbacks, is only 0.559 and 0.546, respectively. This is much lower than the regression applied to the entire draft pool, which gives an SP of 0.981 and 0.969 for the first and second picks. As we can see from the above plot, quarterback is a notoriously volatile position at the beginning of the draft. Some turn out to be greats; others complete busts.
Now, we return to the Rams/Titans trade, updating for Goff:
Rams receive:
2016 picks: 1 (QB), 113, 177
Titans receive:
2016 picks: 15, 43, 45, 76
2017 picks: Rams 2nd and 3rd round
Updating the SP for the first pick being a QB means that the Titans come out on top with a net SP of +2.055. The boom-or-bust nature of selecting a quarterback at #1 makes it look like the Titans are getting away with murder with this trade. But we note that Goff could achieve that #1 overall potential and end up with an SP twice as high as predicted.
The same notion of quarterback value can be applied to the Eagles/Browns trade, updating for Wentz:
Eagles receive:
2016 pick: 2 (QB)
2017 pick: Browns conditional 5th round
Browns receive:
2016 picks: 8, 77, 100
2017 pick: Eagles 1st round
2018 pick: Eagles 2nd round
Updating the SP here means that the Browns come out even farther ahead, with a net SP of +1.725. Again, the production of Wentz makes or breaks this trade.
The Trades: Not-so Blockbusters Edition
Aside from the top two picks being shipped for what looks to be a king’s ransom, there were several other trades of note during day 1. First up, the Browns went all-in on trading down, and when it got to be their turn at pick 8 the Titans came calling, wanting to cash in some of their stash of picks from the Rams trade. Here’s how it stacked up:
Titans receive:
2016 picks: 8, 176
Browns receive:
2016 picks: 15, 76
2017 pick: Titans 2nd round
Here, I’ll forget about who was taken (we’ll examine positional values more in the coming week), and assess the trade at face value. The Titans’ picks are worth 1.014 SP, and the Browns’ picks worth 1.579 SP, for a net of 0.565 SP, the equivalent of the 46th overall pick. This gain in SP represents a +15.023% change in the Browns overall draft stock, and a -14.784% change in the Titans draft stock. A big win for the Browns.
The Bears then moved into the top 10 by trading with the Bucs:
Bears receive:
2016 pick: 9
Bucs receive:
2016 picks: 11, 106
The Bucs didn’t get a whole lot for trading down two picks, but they ended up with a net SP in the trade of +0.248. That 106 pick does carry some good value, and the Bucs see a net change of +9.849% in their total draft stock, while the Bears net change is -9.02%.
Then comes a real head-scratcher. The Texans got extremely antsy sitting at #22, so much so that they traded picks with the Redskins to move up a single spot.
Texans receive:
2016 pick: 21
Redskins receive:
2016 pick: 22
2017 pick: Texans 6th round
Here, the Redskins netted an SP of only +0.047, but then again, they looked like they were content with either Fuller or Doctson, so they got a little something for nothing. The SP represents a net change of +2.136% in draft stock for the Redskins, and a net change of -2.131% for the Texans.
The world champion Broncos then traded up by way of the Seahawks:
Broncos receive:
2016 pick: 26
Seahawks receive:
2016 picks: 31, 94
The Seahawks have some major deficiencies on the offensive line, but were able to trade back five spots and still address it by picking up Germain Ifedi. On top of addressing positional needs, the Seahawks came out with a net of +0.270 SP, the equivalent of the 106th pick. In terms of draft stock, the Seahawks net a +11.388% change, while the Broncos net -11.386%.
Finally, the 49ers moved into the top 30 in their trade with the Chiefs:
49ers receive:
2016 pick: 28
Chiefs receive:
2016 picks: 37, 105, 178
Trading down 9 spots really benefited the Chiefs, who scored a net SP of +0.311, the equivalent of the 94th pick. This represents a net change of draft stock for the Chiefs of +17.364%, and a net change of -9.612% for the 49ers. A huge win for the Chiefs late in the first round.
The Takeaway
According to our draft value chart, trading down netted positive SP for every team which chose to do so. The draft is the perfect dichotomy between the aggressive gambling and the risk management it takes to put together a winning franchise. Some teams are sure enough of their abilities and their current status that they can sit back and wait for the calls to come in, and some teams buzz around drenched in flop sweat, looking for the opportunity to take that one player that could define their franchise. We get that. There have to be those special moments and those special players where a team decides to mortgage their future. But according to our draft value analysis it seems like a better idea to relax, light a cigar, sip some scotch, and wait for the phone to ring.
-J.D. & Andrew

2 comments